
Synopsis: We take an in-depth look at the Q2 FY21 results of Chemcon Speciality Chemicals Limited. The results have been a disappointment, with drop in sales and profitability. There are additional concerns about quality of sales too.
Company released its results to the exchanges on 6th November 2020. We must recall that the company came out with an IPO in the last week of September, and was listed on 1st Oct 2020. So this was its first quarterly result as a public company. Given the strong growth it had shown in the previous 3 fiscals, and the strong listing, there were high expectations from the company, even though the are some concerns about the quality of management of the company. For a complete dissection of the company’s business, you can read my blog – “Chemcon Speciality Chemicals Ltd – Red Herring or True Value?“
Financial Statement Analysis
Here are the key highlights of the results. The background color highlights marked on the financial statements is represented as follows. Green indicates positive, red indicates negative and blue indicates neutral. Lets start with the balance sheet.
Balance Sheet
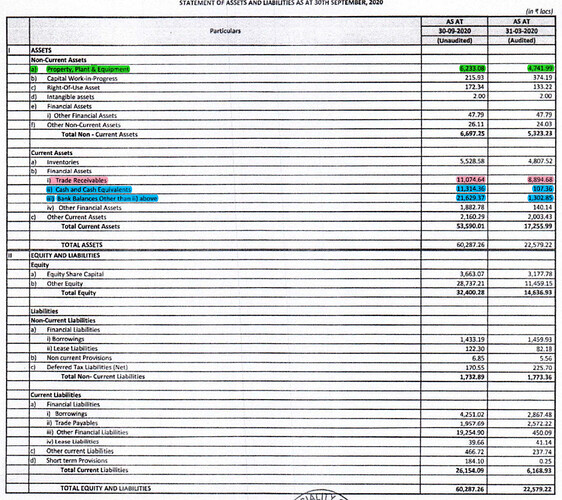
- PPE has gone up from 47.5 Cr to 62 Cr, a rise of about 15 crores. Not sure what this is and where has it been spent. Cash flow statement validates the expenditure, but there are no specific details. Since the company got listed recently, there is no annual report of previous year to validate this from
- Receivables are continuously mounting year after year, and now stand at 110 crores. Similar trend is seen in the past years too. Corresponding figures for FY17, FY18, FY19 and FY 20 are 22 Cr, 29 Cr, 64 Cr and 89 Cr respectively. Between FY17 to FY19, there was an explosive growth, where sales grew from 89 Cr in FY17 to 304 Cr in FY19, so there was some justification for receivables to grow. FY20 sales were down by about 14% to 262 Cr. H1 FY21 sales stand at 107 crores, compared to 154 Cr in H1 FY20, down by over 31%. When seen in this context especially, the steep increase in receivables (23.6%) in a span of 6 months is alarming.
- Just to put the intensity of receivables in perspective – At 110 Cr, its practically at 42% of FY20 sales of 262 Cr. Worse still, for the current year, it exceeds the H1 revenue of 107 Cr!!
- Though the receivables are rapidly going up, the payables are moving in the opposite trend. We see a reduction in payables from 25 Cr in Mar 2020 to 19 Cr in Sep 2020. So while company is increasing its receivables rapidly, its reducing its payables rapidly too. This will surely mean a marked increase in working capital requirements.
- Debt stays steady at around 14 Cr, reducing marginally in last 6 months.
- Cash & Cash Equivalent have increased from 1.07 Cr to 113.14 Cr. Similarly the next item, bank balances too shows a sharp jump from 13 Cr to 216 Cr. These spikes are primarily due to the IPO which company floated in last week of September 2020. The IPO collected about 318 Cr, of which promoters offloaded shares worth 153 Cr through OFS component, while there was a fresh issue of 165 Cr. So about 153 crores collected on behalf of the promoters’ OFS sale. Of remaining, 165 crores is to be utilized as proceeds from IPO. Of this, company’s plan is to utilize about 45 cr for expanding capacity, and about 90 Cr for working capital, and the remaining for other corporate purposes. The company got listed only on 1st October, hence the funds show up on the company’s books as of 30 Sep 2020.
Profit & Loss Statement
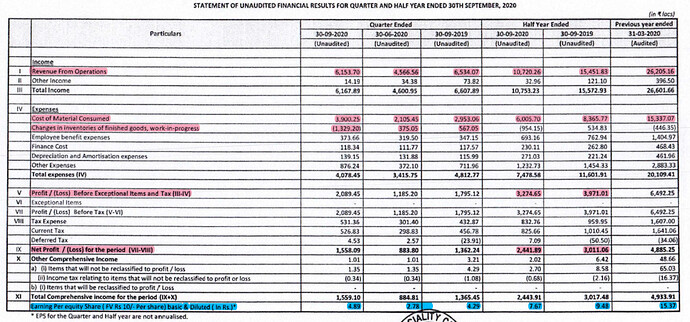
- Revenue in Q2 stood at 61.53 Cr compared to 45.66 Cr in Q1 FY21. Optically, this looks good QoQ, but when compared YoY, it shows a decline of 5.8%. If we compare H1 FY21 to H1 FY20, decline is even more stark, with revenue falling by 30.6%. Company says that decline is due to disruption of operations due to Covid-19 pandemic. While it may be true to certain extent, we do see that most other spec chem companies have shown far more resilient revenues, even though they were hit by the same pandemic.
- Another worrying trend seen in Q2 FY21 P&L is the steep rise in COGS. In Q2 FY20, the COGS was 29.53 Cr on a revenue of 65 Cr, where as the COGS seen in Q2 FY21 is 39 Cr on a revenue of 61.53 Cr. There is a big spike in COGS to the extent of almost 33% YoY. ChemCon has 2 main products HMDS and CMIC. The primary raw materials for these products is TMCS (Trimethlychlorosilane) and MCF (MethylChloroFormate) respectively. It would be worthwhile to check the price trend of these in international markets in 2020 to assess if this is truly due to RM cost going up, or due to some other inefficiencies in operations.
- It must be noted here that Chemcon does not have any long-term purchase contracts with its suppliers, so any spike in prices of raw materials will immediately translate in higher costs for them. Also, it does not have long term supply contracts with its customers, so it may or may not be able to increase prices to its customers. In short, they will experience volatility in margins and profitability if the RM prices fluctuate
- PBT for Q2 FY21 stands at 20.89 Cr compared to 17.95 Cr in Q2 FY20. This is an optical play. How can PBT increase despite sharp increase in prices of raw materials? Its because there has been a sharp reduction in inventory to the tune of 13.29 crores, which boosts the PBT and the PAT.
- PAT comes in at 15.58 Cr compared to 13.62 Cr in Q2 FY 20. The big change in inventory perks up the PAT, and it also perks up the EPS, which stands at Rs 4.89 for the quarter compared to Rs 4.29 for the same quarter in the previous year.
- If the company picks up pace in H2, theoretically, it can still make up for lost ground. But it looks very unlikely that they will see any growth compared to last years revenue. At best, they may end up somewhere close to last years revenue, which of course will be considered below par, given the rich valuations that the company still commands, despite the rapid fall in share prices since the listing day.
Cash Flow Statement
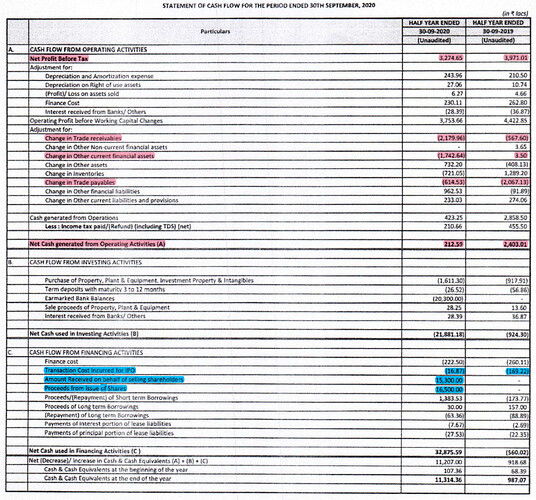
- Cash Flow statement confirms the massive change in receivables to the tune of 21 crores. It also confirms the change in payables. There is also large reduction in current financial assets, about 17.4 Crores.
- Cash flow from Operations has dipped to a mere 2.12 Crores, compared to a healthy 24 Crores from previous year. Its a massive drop. Almost all of the drop can be attributed to the 21 crore increase in receivables. That makes receivable a must watch figure in the next couple of quarters.
- Lastly, we also see the IPO proceeds in CFF as well as 153 Cr received on behalf of the promoters OFS.
Conclusion
The result obviously has not been positive for the company. especially given the current valuations that it command in the market. It was given lofty valuations for 2 reasons. One, it had shown tremendous growth in the past 3 years. Second, the whole spec chem industry has shown stellar performance in last 7 to 8 years, and as a result many of the leading companies in the sector such as Atul, Aarti, Vinati and several others have been given very high valuations by the market. Even Rossari Biotech, which came out with IPO in couple of months earlier, was valued at 50+ multiples. Hence when Chemcon came out with its IPO, the market bestowed great valuations, expecting its past growth trend to continue, especially when the whole sector performance has been outstanding.
However, Chemcon has disappointed with its last 2 quarter results. Management view is that its due to Covid impact. There are clear indications that its definitely not all due to covid alone. There are other factors at play, such as managements inability to mitigate raw material price risks, lack of control on receivables etc.
Hence it becomes very critical to watch the following for the next 2 quarters
- Whether the sales recover or does the slump in performance continues?
- Does the margin pressure continue due to higher raw material prices?
- Receivables must come down to more realistic levels.
- Cash flow recover to healthy levels or not
- In addition, the capacity expansion project should also be tracked closely for timely execution
If these metric do not improve in next couple of quarters, it could be negative for the company.
Disclosure: Not invested at the time of writing this, but may invest or exit at a future date.
Disclaimer: I am not a SEBI registered analyst. This article is for educational purposes only. This is not a stock recommendation, nor an advice to buy or sell a stock. Please consult your financial adviser before you make an investment decision.